
Election Night Live Tracker
My Live Updates From Election Night.

Author’s Note: I’m keeping this simple. Whenever a major organization calls a state for either Harris or Trump, I filter my simulation results for the known outcome and tell you how this alters the election odds. I’ll be updating this page regularly as results trickle in tonight.
Definitions: A landslide is an election where one candidate sweeps all 7 swing states. A nail-biter is an election determined by fewer than 30 electoral votes.
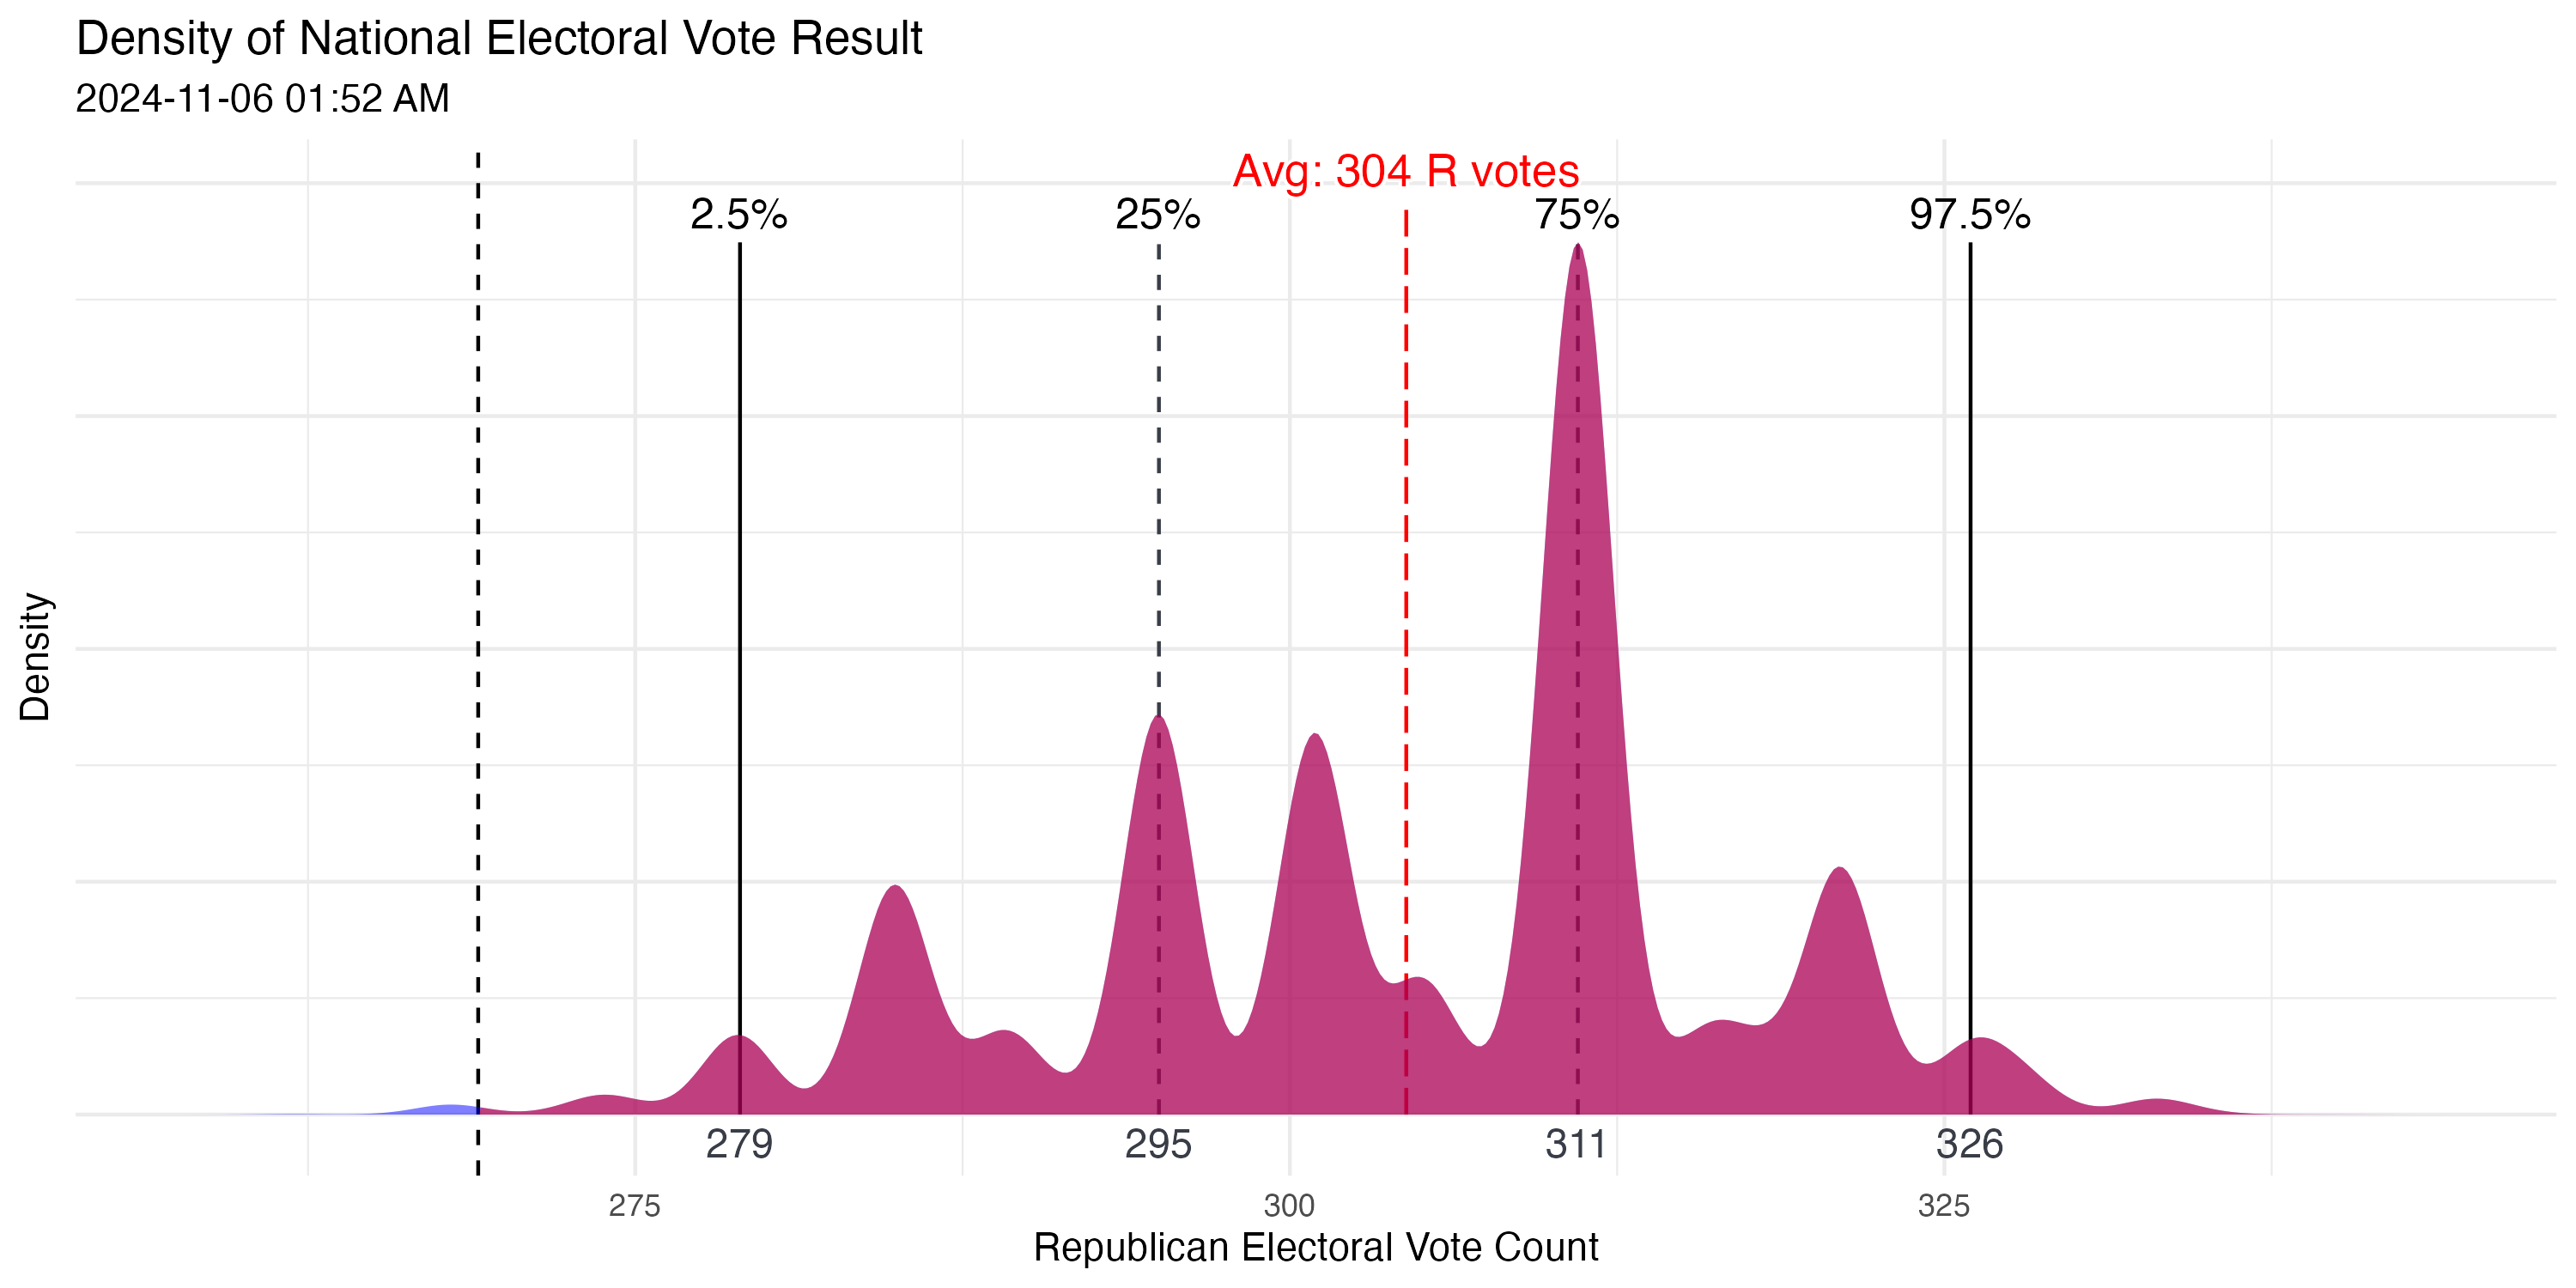
Live Density Plot; Filtered From Raw Sim Results:
This density plot, like the one from my sandbox, filters for called states.1 My topline odds are directly below.
Live Notes & Topline Updates:
1:41 AM:
THE RACE IS NOW SAFE R
Note: I have now added Pennsylvania to my filters, which sealed the result. Harris has a 0.33% chance of winning.
To be more specific: my forecast simulated the election 100,000 times yesterday. When I filter these results for simulations where Trump won every race that’s been called in his favor —most notably North Carolina, Georgia, and Pennsylvania— I am left with 33,006 simulations. In those 33 thousand outcomes, Harris wins the election —by sweeping the remaining swing states of MI, WI, AZ, and NV— only 110 times.
The race is now Safe R. I’m going to bed; I expect to see it called when I wake up.[1] "Harris Win Chance: 0.33%"
[1] "Trump Win Chance: 99.67%"
[1] "Electoral Tie: 0%"
[1] "Nailbiter Chance: 31.35%"
[1] "Landslide Chance: 49.95%"
[1] "Harris Landslide: 0%"
[1] "Trump Landslide: 49.95%"
12:48 AM:
Note: Finally got the Georgia call, so these numbers are official. Harris still has a path through the Rust Belt, and none of MI/WI/PA are out of reach for her, but she’s not likely to sweep all three. I still think these numbers understate her odds, but definitely not by much.
I am working on some more detailed filtering & updates for tomorrow, but there’s not much more in store tonight. I’d recommend getting some sleep - it’s likely to be a slow trickle of Trump-friendly results until 3am ET ish.[1] "Harris Win Chance: 8.06%"
[1] "Trump Win Chance: 90.72%"
[1] "Electoral Tie: 1.22%"
[1] "Nailbiter Chance: 46.17%"
[1] "Landslide Chance: 38.94%"
[1] "Harris Landslide: 0%"
[1] "Trump Landslide: 38.94%"
11:41 PM:
Note: NYT and CNN have now called North Carolina (not Georgia), and I’m set filtering my model with it. These numbers are passing the smell test. The race remains Likely R.
See below for odds with Georgia called for Trump.[1] "Harris Win Chance: 16.17%"
[1] "Trump Win Chance: 81.73%"
[1] "Electoral Tie: 2.09%"
[1] "Nailbiter Chance: 53.07%"
[1] "Landslide Chance: 33.92%"
[1] "Harris Landslide: 0%"
[1] "Trump Landslide: 33.92%"
11:18 PM:
THE RACE IS NOW LIKELY R
Note: I’ve been hesitant to write this update. DDHQ Called Georgia and North Carolina, but it feels early - and my filtering is more aggressive than expected with the first swing-state call. Yet it also feels disingenuous to not share. The forecast is the forecast; I don’t want to make too many ad-hoc adjustments.
DDHQ has the race at 81.7%; I think this is probably more accurate.
You could also average this update with the pre-GA/NC call to extract 75.1% Trump and 23.5% Harris; this is also probably more accurate. But maybe my personal biases are getting in the way.
However you slice it, the race is now Likely R.[1] "Harris Win Chance: 8.06%"
[1] "Trump Win Chance: 90.72%"
[1] "Electoral Tie: 1.22%"
[1] "Nailbiter Chance: 46.17%"
[1] "Landslide Chance: 38.94%"
[1] "Harris Landslide: 0%"
[1] "Trump Landslide: 38.94%"
10:25 PM:
THE RACE NOW LEANS R
Note: I switched to Decision Desk for calls, it’s much faster. There’s still not that much to say. Iowa called for Trump, NH called for Harris (finally) which cuts off some of Trump’s tail landslide odds - but not many. My odds aren’t taking in as much data as the NYT needle, but I still think it’s moving too quickly. Polymarket at 89% is just crazy. We have a way to go.
My odds will update very aggressively as soon as the first swing state is called though.[1] "Harris Win Chance: 38.94%"
[1] "Trump Win Chance: 59.47%"
[1] "Electoral Tie: 1.59%"
[1] "Nailbiter Chance: 67.71%"
[1] "Landslide Chance: 30.7%"
[1] "Harris Landslide: 7.41%"
[1] "Trump Landslide: 23.29%"
9:50 PM:
Note: Still little change, but added Ohio and the density plot above. We may be waiting a while.
[1] "Harris Win Chance: 40.33%"
[1] "Trump Win Chance: 58.3%"
[1] "Electoral Tie: 1.37%"
[1] "Nailbiter Chance: 64.84%"
[1] "Landslide Chance: 37.67%"
[1] "Harris Landslide: 10.29%"
[1] "Trump Landslide: 27.38%"
9:14 PM:
Note: Added NY and a couple R states called by the AP. Little-to-no motion.
[1] "Harris Win Chance: 41.07%"
[1] "Trump Win Chance: 57.58%"
[1] "Electoral Tie: 1.35%"
[1] "Nailbiter Chance: 65.3%"
[1] "Landslide Chance: 38.18%"
[1] "Harris Landslide: 11.16%"
[1] "Trump Landslide: 27.02%"
9:02 PM:
Note: More cutoff on the landslide odds for Harris as Texas is called for Trump, but most of these outcomes had already been lost via Florida. Race has yet to tilt R.
[1] "Harris Win Chance: 41.05%"
[1] "Trump Win Chance: 57.6%"
[1] "Electoral Tie: 1.35%"
[1] "Nailbiter Chance: 65.26%"
[1] "Landslide Chance: 38.23%"
[1] "Harris Landslide: 11.16%"
[1] "Trump Landslide: 27.07%"
8:55 PM:
Note: Most of the changes come from Florida being called early tonight, eliminating some tail-end chances for Harris to win a truly dominant landslide.
[1] "Harris Win Chance: 41.84%"
[1] "Trump Win Chance: 56.83%"
[1] "Electoral Tie: 1.33%"
[1] "Nailbiter Chance: 65.73%"
[1] "Landslide Chance: 38.94%"
[1] "Harris Landslide: 12.25%"
[1] "Trump Landslide: 26.7%"
Called States for Harris:
"Vermont","Connecticut","Maryland","Massachusetts","Rhode.Island","Delaware","Illinois","New.Jersey","Rhode.Island","New.York","New.Hampshire","Colorado","Delaware","Virginia","California"
Called States for Trump:
"Indiana","Kentucky","South.Carolina","West.Virginia","Alabama","Florida","Mississippi","Oklahoma","Tennessee","Texas","South.Dakota","Wyoming","Arkansas","Louisiana","North.Dakota","Wyoming","Ohio","Montana","Nebraska","North.Dakota","Iowa","Wyoming","Utah","North.Carolina","Idaho","Georgia","Pennsylvania"
Author’s Note November 7th: I redesigned the density plot to look more visually appealing. These changes were entirely aesthetic: I reset the limits of the x-axis and added more padding between the labels.
No data was altered, including the timestamp. At the time of the construction only NC, GA, and PA had been called; I did not update this. The plot assumes that WI, MI, AZ and NV are yet to be called.