
Forecast Methodology
How does the model work?

This is a more detailed description of the methodology behind my election forecast.
Methodology: 2024 US Presidential Election Forecast Model
Goal
The primary goal of this forecast model is to simulate and predict the potential outcomes of the 2024 US Presidential Election. This model leverages historical data, polling averages, and statistical methods to estimate the probabilities of various electoral outcomes, both in terms of the national popular vote and the electoral college results.
Process Overview
The process consists of several key steps, from data preparation to final simulation and result analysis. Each step is essential for building an accurate and reliable forecast.
0. Data Preparation
The model begins by preparing and processing historical election data and current polling averages. The key datasets used include:
Historical Election Results: Past presidential election results are used to understand historical voting patterns and errors in polling.
Historical Polling Averages: Past presidential general election polling averages, for the country and for individual states, are used to understand polling errors and trends.
Current Polls: 538’s Presidential General Election polling dataset for the 2024 election cycle is used to establish current polling averages.
Covariance Matrix: A regularized state covariance matrix is used to model the correlation between states' voting behaviors. This matrix is derived from the cycle-on-cycle election vote-share, time-series data between 1972 and 2020.
1. Calculate Polling Averages
Polling averages establish the model’s baseline estimate of state-level metrics. The current margin of each state (D+3, R+0.5, etc) is calculated as a weighted average of three metrics:
Sample Size (size_weight): The sample size weight is calculated as the square root of the sample size divided by the square root of the median sample size.
Pollster Quality (grade_weight): The pollster quality is derived from 538’s Pollster Ratings which you can read more about here. I give each ungraded pollster the minimum rating, then increase the value of all ratings by 0.5.
This keeps the grade weight within a range of 3.5x between the best and worst pollster, as opposed to 6x.
Poll Age (date_weight): Most importantly, I exponentially weight of each poll by its age. The weight is a magic number called smooth, usually 0.9, taken to the nth power where n is the number of days since the median date of the poll.
This metric results in polls from today (0 days) being weighted at 1, a week ago (7 days) being weighted at 0.48, and from a month ago (31 days) being weighted at 0.04.
Polls that are sponsored by a partisan affiliate or more than a month old are not factored into the averages.
2. Calculate Polling Errors
Polling errors are a crucial component in election forecasting. The model calculates the mean polling error1 and the standard deviation (SD) of these errors based on historical data.
National-Level Polling Error: The model calculates the standard deviation of polling errors from 1968 onwards.
State-Level Polling Errors: The model calculates the average and standard deviation of polling errors for each state. This calculation is based on elections from 2000 onwards.
3. Estimating Polling Movement Uncertainty
The model estimates the uncertainty in the possible polling movement as the election day approaches. This uncertainty is influenced by the time remaining until the election, with more uncertainty at earlier stages and less as the election date nears, as well as the election cycle’s prior polling volatility.
Uncertainty SD: The model estimates the SD of uncertainty in the election based on two factors: The number of days remaining until the election, and the volatility of the head-to-head polling data.
4. Generating Priors
Priors for each state are taken from either the current polling averages or, where polling data is unavailable, from a weighted average of the results of the past two elections shifted by the national delta. This step ensures that the model has a baseline of each state's political leanings.
National Delta: The national swing or trend from previous elections is adjusted based on current polling data to reflect the present political environment.
5. Simulation of Election Outcomes
The core of the model is the simulation of election outcomes. The model runs 50,000 simulations (NSIM = 50,000) to estimate the range of possible election outcomes. The simulation accounts for both state-level and national polling errors, as well as the correlations between states.
This is likely the most important line of code in the model, estimating the margin-of-victory in each state, for a single simulation, from a sum of discretized errors:
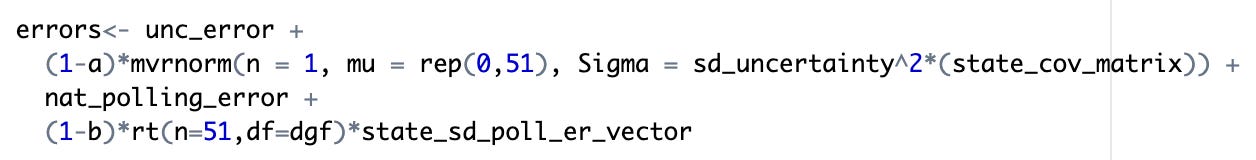
Prior code estimated discrete values for the national-level uncertainty and polling errors in this simulation.
The state-level uncertainty error2 is estimated as a multivariate random normal distribution with correlations determined by a state covariance matrix.
The state-level polling errors are left uncorrelated and derived from a student’s distribution with historical polling errors.
The constants a and b are magic numbers that determine the weight assigned between national and state-level errors. They are evaluated with a series of regularized regressions on prior election data.
6. Post-Simulation Wrangling
After the simulations are complete, the results are processed to produce final outputs:
Final Results: These include the projected outcomes for each state and the overall electoral college tally.
Raw Results: These provide detailed data on the vote margins and electoral outcomes from each simulation run.
Tipping Point Odds: The model identifies key states that could tip the election outcome.
7. Model Testing
The model undergoes rigorous testing to ensure its accuracy and reliability. This includes:
State Conditionals: Testing the conditional outcomes in specific states based on different scenarios.
Result Comparison: The model compares current results against prior ones and makes note of any large changes.
Comparison to Historical Results: The forecast is compared to past election results to validate the model's predictions.
8. Writing and Saving Results
Finally, the results of the model are written to CSV files for further analysis and reporting. The data is also saved in the FST format for efficient storage and retrieval.
Historical Forecast: The model updates and saves the historical forecast data to track how predictions evolve over time as new data becomes available.
Conclusion
This model offers a detailed and systematic approach to forecasting the 2024 US Presidential Election. By integrating historical election results, current polling data, and advanced statistical methods, it simulates a wide range of possible outcomes, and hopefully serves as a valuable tool for analysts, strategists, and anyone interested in understanding the dynamics of the upcoming election.3
I hope this description helped you to understand what’s going on behind-the-scenes. Don’t hesitate to reach out if you have any questions or would like a more detailed explanation of any section;4 I want to make the project as accessible as possible.5

But does not use them, as errors are assumed to be distributed symmetrically around the origin.
This is the estimated polling movement between the simulation and election dates.
Yes, chatGPT wrote a decent chunk of this page and this part. Good catch. I wanted to use a more formal tone for the methodology (and got a bit lazy). It made a perfectly fine draft, and I’ve edited everything that needed to be changed.
I’m planning to write up a very formal academic paper in LaTeX as a last level of methodological detail, but that will take a bit.